Highlights H1 2024 1
Effects on Group Sales | T002 | |
|---|---|---|
in EUR mill. | Share in % | |
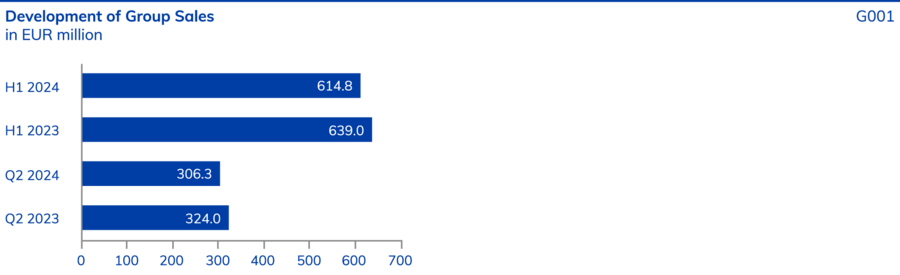
Group sales H1 2023 | 639.0 | |
Organic growth | -22.2 | -3.5 |
Acquisition effects | 1.2 | 0.2 |
Currency effects | -3.1 | -0.5 |
Group sales H1 2024 | 614.8 | -3.8 |
1 Deviations in decimal places may occur due to commercial rounding.
Sales Development in the Strategic Business Units | T003 | |
|---|---|---|
Industry Applications (IA 1 | H1 2024 | H1 2023 |
Sales (in EUR million) | 109.7 | 119.4 |
Growth (in %) | -8.1 | |
Share of sales (in %) | 18 | 19 |
Water Management (WM) 1 | H1 2024 | H1 2023 |
Sales (in EUR million) | 157.6 | 149.3 |
Growth (in %) | 5.6 | |
Share of sales (in %) | 26 | 23 |
Mobility & New Energy (MNE) 2 | H1 2024 | H1 2023 |
Sales (in EUR million) | 347.4 | 370.2 |
Growth (in %) | -6.2 | |
Share of sales (in %) | 56 | 58 |
1_Formerly distribution channel Standardized Joining Technology (SJT). 2_Formerly distribution channel Engineered Joining Technology (EJT). | ||

Net Operating Cash Flow | T004 | |
|---|---|---|
in EUR million | H1 2024 | H1 2023 |
EBITDA | 81.4 | 78.6 |
Changes in working capital | -19.7 | -60.5 |
Investments from operating business | -20.5 | -31.0 |
Net operating cash flow | 41.2 | -12.9 |
Legend
These contents are part of the Non-financial Group Report and were subject to a separate limited assurance examination.