HIGHLIGHTS H1 2023 1
|
Effects on Group Sales |
T003 |
|
|---|---|---|
|
in EUR mill. |
Share in % |
|
|
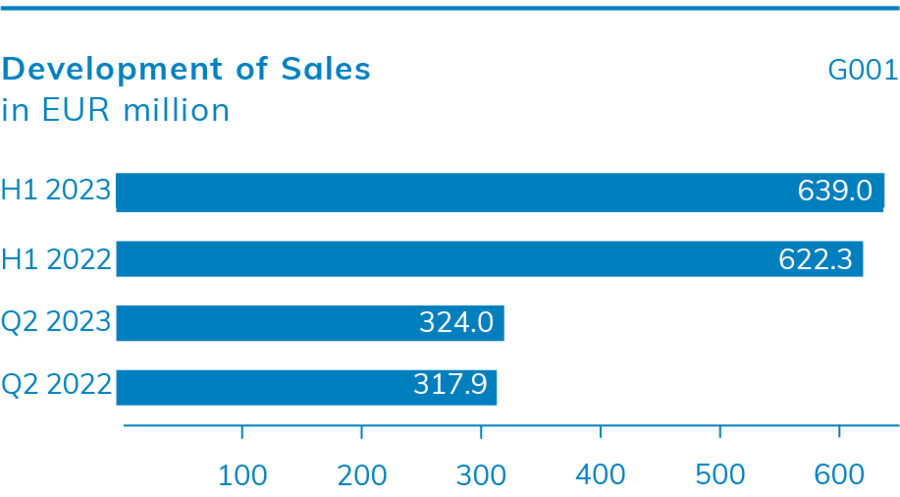
Group sales H1 2022 |
622.3 |
|
|
Organic growth |
19.1 |
3.1 |
|
Currency effects |
-2.4 |
-0,4 |
|
Group sales H1 2023 |
639.0 |
2.7 |
|
Development of Sales Channels |
T002 |
|||
|---|---|---|---|---|
|
Engineered Joining Technology (EJT) |
Standardized Joining Technology (SJT) | |||
|
H1 2023 |
H1 2022 |
H1 2023 |
H1 2022 |
|
|
Group sales (in EUR million) |
369.0 |
338.6 |
267.1 |
278.7 |
|
Growth (in %) |
9.0 |
-4.2 |
||
|
Share of sales (in %) |
58.0 |
54.8 |
42.0 |
45.2 |
1 Deviations in decimal places may occur due to commercial rounding.
|
Net Operating Cash Flow |
T004 |
|
|---|---|---|
|
in EUR million |
H1 2023 |
H1 2022 |
|
EBITDA |
78.6 |
81.1 |
|
Changes in working capital |
-60.5 |
-53.4 |
|
Investments from operating business |
-31.0 |
-17.9 |
|
Net operating cash flow |
-12.9 |
9.8 |